Insights and News
Learn what’s new and read our insights about Microsoft Dynamics 365 and the Power Platform.

A grant application people won’t dread
How a Dynamics 365 grant portal lowers the effort of applying and links every submission to your existing records.

Volunteer Registration that Doesn’t Start with a Spreadsheet
Sign up volunteers, capture their interests and start screening checks in one portal, with every detail held in your CRM.

Which AI Agent Idea Will Pay Back Fastest?
Not sure which AI agent idea to back first? 4 practical questions to find the ones that will pay back fastest, and avoid wasted resources.
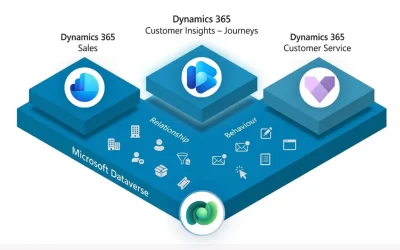
What Real-Time Marketing in Dynamics 365 Changes for Your Organisation
Run Dynamics 365 but manage marketing separately? See what changes when real-time marketing sits on the same platform as CRM.
Microsoft 2026 Work Trend Index Reveals Where AI Value Comes From
Microsoft’s 2026 Work Trend Index shows AI’s impact is decided by organisations, not individuals. Here’s what it means for leaders.

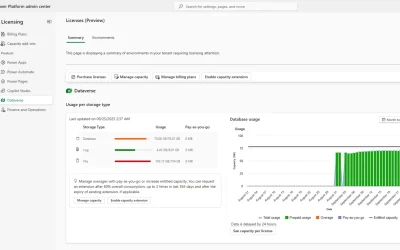
Why Dynamics 365 Sales Premium Boosts Dataverse Capacity
A Dynamics 365 Sales Premium licence will increase your default Dataverse storage at less than the cost of buying that capacity as an add-on.
Deprecated: Editable Grid & Read-Only Grid for Power Apps & Dynamics 365
Microsoft has deprecated the Editable Grid and Read-Only Grid controls. Here’s what it means for your Dynamics 365 environment.

4 Dynamics 365 Portal Types Beyond Customer Self-Service
Customer self-service isn’t the only role for a Dynamics 365 portal. See where community, supplier, accreditation and research portals fit.

What Is Modern CRM, And Why It Should Change Your Thinking
Modern CRM is no longer a contacts database. Four shifts every leadership team should understand before CRM investment decisions.
Why Dynamics 365 Sales Premium Boosts Dataverse Capacity
A Dynamics 365 Sales Premium licence will increase your default Dataverse storage at less than the cost of buying that capacity as an add-on.

Good Scoping Feels Challenging. Bad Scoping Is Expensive.
Why the best Dynamics 365 projects start with honest dialogue and constructive challenge during scoping to protects your time and budget.
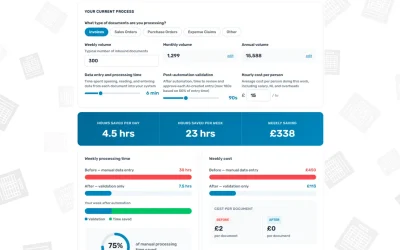
What Does Manual Document Processing Cost You?
Manual document processing in Dynamics 365 has a cost many businesses don’t measure. Use our free calculator to see what yours adds up.
Is Dynamics 365 Delivering What Your Business Needs?
How our business-first review of a Dynamics 365 setup can reveal what’s been missed and where quick wins are.

Power Apps vs Power Pages: Which Do You Need With Dynamics 365?
Internal teams or external stakeholders? Understand the core differences between Power Pages and Power Apps.

From Document to Dynamics 365 Without Manual Data Entry
AI agents can read documents, extract data, and apply your business rules before updating Dynamics 365. Here’s where to start.

Derisking Your Digital Transformation Project
Worried about your digital transformation project? Discover lessons from of successful UK projects and the decisions that deliver ROI.

Is Your AI Pilot at Risk of Failing? Here’s What Delivers Success
Why do most AI pilots stall before production? Research reveals what separates success from failure – and it’s not the technology.

How to Choose a Dynamics 365 Support Partner: A No-Nonsense Guide
Get clarity when choosing a Dynamics 365 support partner. Learn what to look for and how to find a partner who invests in your success.
Deprecated: Editable Grid & Read-Only Grid for Power Apps & Dynamics 365
Microsoft has deprecated the Editable Grid and Read-Only Grid controls. Here’s what it means for your Dynamics 365 environment.
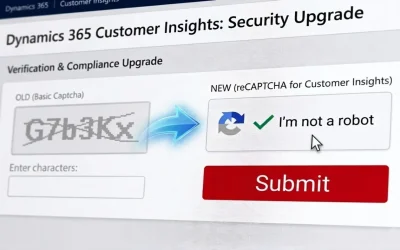
Setup Modern reCAPTCHA in Dynamics 365 Customer Insights Forms
Microsoft finally adds reCAPTCHA to Dynamics 365 Customer Insights. Learn how to set it up, avoid pitfalls, and stop spam ruining your data.
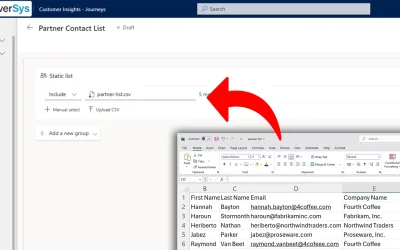
Faster Segmentation in Dynamics 365 Customer Insights with CSV Imports
Use Real-time Journeys CSV upload feature for creating large static segments. Drag, drop, and auto match contacts for simpler, segmentation.

Build Consistent Sales Processes That Scale Using Dynamics 365 Sales Accelerator
Learn how Dynamics 365 Sales Accelerator builds consistent, scalable sales processes with intelligent work lists and automated sequences.

Unlock Insights with New Hierarchical Relationship Visualiser in Dynamics 365 Sales
Discover how the New Hierarchical Relationship Visualiser in Dynamics 365 helps sales map relationships and unlock hidden opportunities.
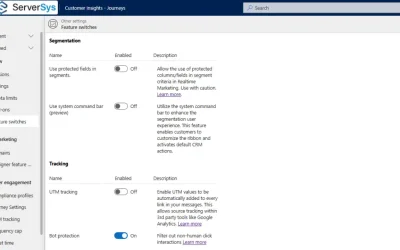
12 Dynamics 365 Marketing Features: Should You Enable Them?
Review 12 optional Dynamics 365 marketing features to assess if they should be enabled within your organisation.

Dynamics 365 Activity Management: Manual Tasks to Intelligent Automation
Master Dynamics 365 activity management. This guide covers everything from timelines and bookmarks to automation and Copilot summaries.
2025 Release Wave 2 Highlights for Dynamics 365, Power Platform and Copilot
Discover key Dynamics 365 CRM and Power Platform features in the 2025 Release Wave 2.
External AI in Your Dynamics: Innovation Opportunity or Security Risk?
Discover the benefits and risks of using external AI tools with Dynamics 365 and key policies for secure CRM AI integration

Dynamics 365 – 2026 Release Wave 1 in Summary
Our summary of the 2026 Release Wave 1 for Dynamics 365. AI agents, journey upgrades, and what matters for Sales, Service, and Marketing.
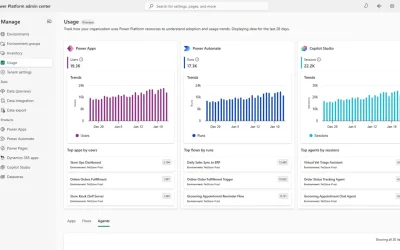
New Custom Alerts in the Power Platform Admin Centre
Power Platform Admin Centre new alerts feature lets admins monitor flows, agents and apps through custom thresholds, not manual checks.
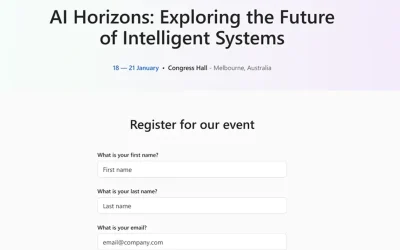
Create a Branded Event Hub with Power Pages and D365 Customer Insights
Bring all your Customer Insights Events in one central hub, simplifying registration while reinforcing your brand.
Faster Segmentation in Dynamics 365 Customer Insights with CSV Imports
Use Real-time Journeys CSV upload feature for creating large static segments. Drag, drop, and auto match contacts for simpler, segmentation.
Unlock Insights with New Hierarchical Relationship Visualiser in Dynamics 365 Sales
Discover how the New Hierarchical Relationship Visualiser in Dynamics 365 helps sales map relationships and unlock hidden opportunities.
2025 Release Wave 2 Highlights for Dynamics 365, Power Platform and Copilot
Discover key Dynamics 365 CRM and Power Platform features in the 2025 Release Wave 2.
External AI in Your Dynamics: Innovation Opportunity or Security Risk?
Discover the benefits and risks of using external AI tools with Dynamics 365 and key policies for secure CRM AI integration

Refine Segments with Marketing Signals in Customer Insights – Data
Discover how new segmentation features in Customer Insights – Data let you target audiences using marketing engagement signals.

How Copilot Content Assist Improves D365 Customer Service Emails
Boost customer service efficiency with Copilot Content Assist for drafting for faster, clearer, and more accurate responses.
A grant application people won’t dread
How a Dynamics 365 grant portal lowers the effort of applying and links every submission to your existing records.
Volunteer Registration that Doesn’t Start with a Spreadsheet
Sign up volunteers, capture their interests and start screening checks in one portal, with every detail held in your CRM.
4 Dynamics 365 Portal Types Beyond Customer Self-Service
Customer self-service isn’t the only role for a Dynamics 365 portal. See where community, supplier, accreditation and research portals fit.

Why Power Pages Websites Are About to Do More
AI agents are coming to Power Pages. What this means for the people who use your portal, and what your organisation needs to be ready.

What You Need to Know About Power Pages Security
How Microsoft protects data in Power Pages and the configuration decisions that determine your security.
Power Apps vs Power Pages: Which Do You Need With Dynamics 365?
Internal teams or external stakeholders? Understand the core differences between Power Pages and Power Apps.

New Server-Side Logic for Power Pages
Power Pages server-side logic preview: secure integrations without the infrastructure overhead.
Create a Branded Event Hub with Power Pages and D365 Customer Insights
Bring all your Customer Insights Events in one central hub, simplifying registration while reinforcing your brand.

Power Pages Data Exposure: The Configuration Errors Putting Data at Risk
Misconfigurations in Power Pages can expose sensitive data. Learn how wildcard settings and global access create hidden risks for portals.
Why Dynamics 365 Sales Premium Boosts Dataverse Capacity
A Dynamics 365 Sales Premium licence will increase your default Dataverse storage at less than the cost of buying that capacity as an add-on.
Power Apps vs Power Pages: Which Do You Need With Dynamics 365?
Internal teams or external stakeholders? Understand the core differences between Power Pages and Power Apps.

Microsoft Enterprise Agreement Volume Licensing Discounts End November 2025
Microsoft removes Enterprise Agreement volume discounts in November 2025. Discover the budget impact and why CSP may be your best option.
A Quick Guide to Licensing Dynamics 365 Customer Insights
Get a clear overview of D365 Customer Insights licensing. Explore tenant-based licenses, default capacities, and fair usage policies.

Microsoft UK Pricing Decreases and Increases: How to Save on Your Licence Costs in 2025
Learn how Microsoft UK pricing changes could impact your license costs and discover ways to save before April 2025.

A Guide to Microsoft Power Pages Licensing
How Power Pages licensing works, including authenticated and anonymous user meters, use rights with Dynamics and PAYG billing.

Dynamics 365 Sales Professional vs Enterprise Licence Comparison
Understand the key differences between Dynamics 365 Sales licenses, including functionalities, storage and entitlements for cost-effective decisions.

How to Licence Microsoft Dynamics 365 Customer Service
Are you overpaying for Dynamics 365 Customer Service licenses? Learn more about the options here.

15 Ideas to Level Up Your Dynamics 365 CRM System
Elevate your Dynamics 365 CRM system with these user-focused enhancements, data management best practices and features.
Deprecated: Editable Grid & Read-Only Grid for Power Apps & Dynamics 365
Microsoft has deprecated the Editable Grid and Read-Only Grid controls. Here’s what it means for your Dynamics 365 environment.
Why Power Pages Websites Are About to Do More
AI agents are coming to Power Pages. What this means for the people who use your portal, and what your organisation needs to be ready.
What You Need to Know About Power Pages Security
How Microsoft protects data in Power Pages and the configuration decisions that determine your security.
Power Apps vs Power Pages: Which Do You Need With Dynamics 365?
Internal teams or external stakeholders? Understand the core differences between Power Pages and Power Apps.
From Document to Dynamics 365 Without Manual Data Entry
AI agents can read documents, extract data, and apply your business rules before updating Dynamics 365. Here’s where to start.
Dynamics 365 – 2026 Release Wave 1 in Summary
Our summary of the 2026 Release Wave 1 for Dynamics 365. AI agents, journey upgrades, and what matters for Sales, Service, and Marketing.
New Custom Alerts in the Power Platform Admin Centre
Power Platform Admin Centre new alerts feature lets admins monitor flows, agents and apps through custom thresholds, not manual checks.
New Server-Side Logic for Power Pages
Power Pages server-side logic preview: secure integrations without the infrastructure overhead.
Create a Branded Event Hub with Power Pages and D365 Customer Insights
Bring all your Customer Insights Events in one central hub, simplifying registration while reinforcing your brand.
Which AI Agent Idea Will Pay Back Fastest?
Not sure which AI agent idea to back first? 4 practical questions to find the ones that will pay back fastest, and avoid wasted resources.
Microsoft 2026 Work Trend Index Reveals Where AI Value Comes From
Microsoft’s 2026 Work Trend Index shows AI’s impact is decided by organisations, not individuals. Here’s what it means for leaders.
What Does Manual Document Processing Cost You?
Manual document processing in Dynamics 365 has a cost many businesses don’t measure. Use our free calculator to see what yours adds up.
Why Power Pages Websites Are About to Do More
AI agents are coming to Power Pages. What this means for the people who use your portal, and what your organisation needs to be ready.
From Document to Dynamics 365 Without Manual Data Entry
AI agents can read documents, extract data, and apply your business rules before updating Dynamics 365. Here’s where to start.

A Sales Leader’s Guide to Dynamics 365 Sales Agents
Agents in Dynamics 365 Sales give your team the time and context to close more deals. This guide explains what each one does.
Is Your AI Pilot at Risk of Failing? Here’s What Delivers Success
Why do most AI pilots stall before production? Research reveals what separates success from failure – and it’s not the technology.

A Quick Guide to AI Agent Governance
Summarising Microsoft’s Administering and Governing Agents report. Get actionable takeaways for secure AI agent governance
External AI in Your Dynamics: Innovation Opportunity or Security Risk?
Discover the benefits and risks of using external AI tools with Dynamics 365 and key policies for secure CRM AI integration
What Is Modern CRM, And Why It Should Change Your Thinking
Modern CRM is no longer a contacts database. Four shifts every leadership team should understand before CRM investment decisions.
Good Scoping Feels Challenging. Bad Scoping Is Expensive.
Why the best Dynamics 365 projects start with honest dialogue and constructive challenge during scoping to protects your time and budget.
What Does Manual Document Processing Cost You?
Manual document processing in Dynamics 365 has a cost many businesses don’t measure. Use our free calculator to see what yours adds up.
Is Dynamics 365 Delivering What Your Business Needs?
How our business-first review of a Dynamics 365 setup can reveal what’s been missed and where quick wins are.
From Document to Dynamics 365 Without Manual Data Entry
AI agents can read documents, extract data, and apply your business rules before updating Dynamics 365. Here’s where to start.
Derisking Your Digital Transformation Project
Worried about your digital transformation project? Discover lessons from of successful UK projects and the decisions that deliver ROI.
How to Choose a Dynamics 365 Support Partner: A No-Nonsense Guide
Get clarity when choosing a Dynamics 365 support partner. Learn what to look for and how to find a partner who invests in your success.

Why Frequent Conversations Maximise Dynamics 365 Value
Regular conversations with your Dynamics 365 partner reveal opportunities and insights that email exchanges can’t. Learn why they matter.

Is Your Dynamics 365 System Getting the Attention It Deserves?
General IT providers often lack the Dynamics 365 expertise. Specialist partners help you clear backlogs and get more from the system.
Which AI Agent Idea Will Pay Back Fastest?
Not sure which AI agent idea to back first? 4 practical questions to find the ones that will pay back fastest, and avoid wasted resources.
Derisking Your Digital Transformation Project
Worried about your digital transformation project? Discover lessons from of successful UK projects and the decisions that deliver ROI.

The Real Cost of ‘Good Enough’ Dynamics 365 Support
Paying for Dynamics 365 but only scratching the surface? Discover the hidden costs of reactive support and what partnership should deliver.

Dynamics 365 ROI: How to Define Success
Explore how to assess Dynamics 365 ROI and what good looks like. Discover six critical areas where measurable performance gains are made.

A Guide to Microsoft Web Portal Capabilities
Announcing our latest guide exploring how intelligent web portals enhance agility and meet customer needs by reimagining digital interactions
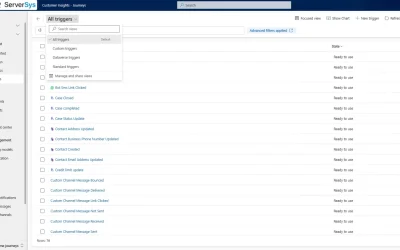
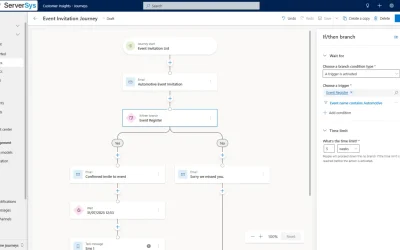
How to Use Journey Triggers in Dynamics 365 Customer Insights to Go Beyond Bulk Email
Move beyond bulk emails. Discover trigger-based marketing with Dynamics 365 for relevant, timely communications that drive results.

AI in Action: Insights from Microsoft’s Work Trends Index 2025
Discover highlights from Microsoft’s 2025 Work Trend Index, including how AI and agents increase scale and boost meaningful work outcomes.

How AI Agents Benefit Membership Organisations
Discover how AI agents empower membership organisations to enhance operational agility, deliver smarter processes, and support member growth.

Drive Growth with Agentic AI: Key Insights from Microsoft’s Agents of Change Report 2025
Findings from Microsoft’s Agents of Change report reveal how agentic AI is driving growth and transforming productivity for UK businesses.
Why Frequent Conversations Maximise Dynamics 365 Value
Regular conversations with your Dynamics 365 partner reveal opportunities and insights that email exchanges can’t. Learn why they matter.

How Hill Dickinson Advanced Its Digital Transformation with ServerSys
Explore Hill Dickinson’s digital leap forward with ServerSys,harnessing Dynamics 365 for seamless client engagement and innovation.

Launch Dynamics 365 Right With These Planning Steps
Navigate your Dynamics 365 CRM project with ease. Our guide provides a detailed roadmap for efficient project ‘go-live’, leading your business towards growth and innovation.
A grant application people won’t dread
How a Dynamics 365 grant portal lowers the effort of applying and links every submission to your existing records.
Volunteer Registration that Doesn’t Start with a Spreadsheet
Sign up volunteers, capture their interests and start screening checks in one portal, with every detail held in your CRM.
4 Dynamics 365 Portal Types Beyond Customer Self-Service
Customer self-service isn’t the only role for a Dynamics 365 portal. See where community, supplier, accreditation and research portals fit.
Why Power Pages Websites Are About to Do More
AI agents are coming to Power Pages. What this means for the people who use your portal, and what your organisation needs to be ready.
What You Need to Know About Power Pages Security
How Microsoft protects data in Power Pages and the configuration decisions that determine your security.
Power Apps vs Power Pages: Which Do You Need With Dynamics 365?
Internal teams or external stakeholders? Understand the core differences between Power Pages and Power Apps.
New Server-Side Logic for Power Pages
Power Pages server-side logic preview: secure integrations without the infrastructure overhead.
Create a Branded Event Hub with Power Pages and D365 Customer Insights
Bring all your Customer Insights Events in one central hub, simplifying registration while reinforcing your brand.
Power Pages Data Exposure: The Configuration Errors Putting Data at Risk
Misconfigurations in Power Pages can expose sensitive data. Learn how wildcard settings and global access create hidden risks for portals.
What You Need to Know About Power Pages Security
How Microsoft protects data in Power Pages and the configuration decisions that determine your security.
Setup Modern reCAPTCHA in Dynamics 365 Customer Insights Forms
Microsoft finally adds reCAPTCHA to Dynamics 365 Customer Insights. Learn how to set it up, avoid pitfalls, and stop spam ruining your data.
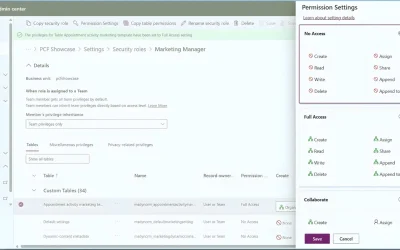
A Clear Guide to Security Roles in Dynamics 365
A concise guide to security roles in Dynamics 365, covering permissions, privileges, access levels, and building a model that works.
Power Pages Data Exposure: The Configuration Errors Putting Data at Risk
Misconfigurations in Power Pages can expose sensitive data. Learn how wildcard settings and global access create hidden risks for portals.
External AI in Your Dynamics: Innovation Opportunity or Security Risk?
Discover the benefits and risks of using external AI tools with Dynamics 365 and key policies for secure CRM AI integration
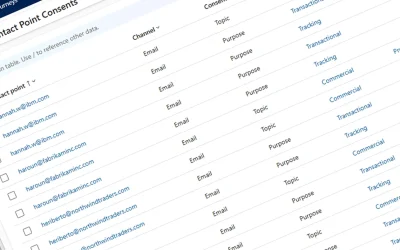
Managing Consent and Compliance Profiles in Dynamics 365 Real-Time Journeys
Configure consent and compliance profiles in Dynamics 365 to ensure GDPR compliance and respect your customer preferences.

Best Practices for Managing Client Secrets in Dynamics 365
Secure your Dynamics 365 integrations with practical client secret management. Explore 5 strategies to enhance security and continuity.

Is Your Dynamics 365 Audit Policy Aligned with Your Business Needs?
Are your Dynamics 365 audit settings up to date? Avoid compliance gaps and security risks.

Ask the Consultant – Insights for Building Dynamics 365 Solutions
Insights on best practices, customisation, and deployment of Microsoft Dynamics 365 and Power Platform from our experienced consultants.
Why Dynamics 365 Sales Premium Boosts Dataverse Capacity
A Dynamics 365 Sales Premium licence will increase your default Dataverse storage at less than the cost of buying that capacity as an add-on.
How to Free Up Dataverse Storage Before Purchasing Add-On Capacity
Discover cost-effective Microsoft Dataverse storage optimisation tactics before purchasing add-on capacity packs.

New Dataverse Recycle Bin to Restore Deleted Records
Accidentally deleting one or more Dynamics 365 records is a dreaded experience. Deleting an account is particularly harmful because cascading...
Is Your Dynamics 365 Audit Policy Aligned with Your Business Needs?
Are your Dynamics 365 audit settings up to date? Avoid compliance gaps and security risks.

Behind the Scenes: How our Support Team Powers Customer Success with Dynamics 365
Discover how our dedicated support ensures smooth operations in Dynamics 365.

How to Add Document Metadata to Attached Files in Dynamics 365
Improve Dynamics 365 file management with a solution that adds metadata, enhances document organisation and saves time.
Reduce Dataverse Storage Consumption by Reviewing Copilot Transcript Retention
Learn to optimise your Dataverse storage by efficiently managing Copilot transcripts from Dynamics 365 and Power Apps.
15 Ideas to Level Up Your Dynamics 365 CRM System
Elevate your Dynamics 365 CRM system with these user-focused enhancements, data management best practices and features.

How to Reduce Dynamics 365 Costs with Azure Blob Storage
Cut Dynamics 365 storage costs significantly with Azure Blob Storage. Smart, secure, and cost-effective data archiving for your business
Is Your AI Pilot at Risk of Failing? Here’s What Delivers Success
Why do most AI pilots stall before production? Research reveals what separates success from failure – and it’s not the technology.
A Quick Guide to AI Agent Governance
Summarising Microsoft’s Administering and Governing Agents report. Get actionable takeaways for secure AI agent governance
2025 Release Wave 2 Highlights for Dynamics 365, Power Platform and Copilot
Discover key Dynamics 365 CRM and Power Platform features in the 2025 Release Wave 2.
AI in Action: Insights from Microsoft’s Work Trends Index 2025
Discover highlights from Microsoft’s 2025 Work Trend Index, including how AI and agents increase scale and boost meaningful work outcomes.
How Copilot Content Assist Improves D365 Customer Service Emails
Boost customer service efficiency with Copilot Content Assist for drafting for faster, clearer, and more accurate responses.

Copilot Chart Visuals for Dynamics 365 Views
Discover automated chart visuals for Dynamics 365 views, enabling efficient data interpretation with AI-powered Copilot insights.
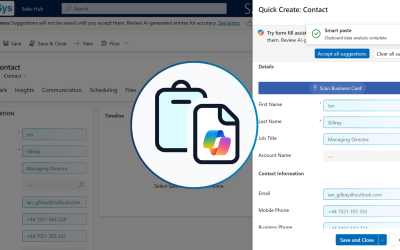
Accelerate Dynamics 365 Record Creation with Smart Paste Form Fill
Boost productivity in Dynamics 365 with Copilot’s Smart Paste. Simplify data entry, save time, and enhance accuracy. See how it works.

AI Adoption: A Framework for UK Businesses
Discover strategies for successful AI adoption. Enhance operations and stay agile with practical, innovative solutions.

Automatically create Knowledge Articles with the Copilot Knowledge Management Agent
Discover how to efficiently update your knowledge base using Dynamics 365’s Customer Knowledge Management Agent.
Why Dynamics 365 Sales Premium Boosts Dataverse Capacity
A Dynamics 365 Sales Premium licence will increase your default Dataverse storage at less than the cost of buying that capacity as an add-on.
A Sales Leader’s Guide to Dynamics 365 Sales Agents
Agents in Dynamics 365 Sales give your team the time and context to close more deals. This guide explains what each one does.
A Clear Guide to Security Roles in Dynamics 365
A concise guide to security roles in Dynamics 365, covering permissions, privileges, access levels, and building a model that works.
Dynamics 365 – 2026 Release Wave 1 in Summary
Our summary of the 2026 Release Wave 1 for Dynamics 365. AI agents, journey upgrades, and what matters for Sales, Service, and Marketing.
Build Consistent Sales Processes That Scale Using Dynamics 365 Sales Accelerator
Learn how Dynamics 365 Sales Accelerator builds consistent, scalable sales processes with intelligent work lists and automated sequences.
Unlock Insights with New Hierarchical Relationship Visualiser in Dynamics 365 Sales
Discover how the New Hierarchical Relationship Visualiser in Dynamics 365 helps sales map relationships and unlock hidden opportunities.
Dynamics 365 Activity Management: Manual Tasks to Intelligent Automation
Master Dynamics 365 activity management. This guide covers everything from timelines and bookmarks to automation and Copilot summaries.
2025 Release Wave 2 Highlights for Dynamics 365, Power Platform and Copilot
Discover key Dynamics 365 CRM and Power Platform features in the 2025 Release Wave 2.
External AI in Your Dynamics: Innovation Opportunity or Security Risk?
Discover the benefits and risks of using external AI tools with Dynamics 365 and key policies for secure CRM AI integration
A Clear Guide to Security Roles in Dynamics 365
A concise guide to security roles in Dynamics 365, covering permissions, privileges, access levels, and building a model that works.
Dynamics 365 – 2026 Release Wave 1 in Summary
Our summary of the 2026 Release Wave 1 for Dynamics 365. AI agents, journey upgrades, and what matters for Sales, Service, and Marketing.
Dynamics 365 Activity Management: Manual Tasks to Intelligent Automation
Master Dynamics 365 activity management. This guide covers everything from timelines and bookmarks to automation and Copilot summaries.
2025 Release Wave 2 Highlights for Dynamics 365, Power Platform and Copilot
Discover key Dynamics 365 CRM and Power Platform features in the 2025 Release Wave 2.
How Copilot Content Assist Improves D365 Customer Service Emails
Boost customer service efficiency with Copilot Content Assist for drafting for faster, clearer, and more accurate responses.
Accelerate Dynamics 365 Record Creation with Smart Paste Form Fill
Boost productivity in Dynamics 365 with Copilot’s Smart Paste. Simplify data entry, save time, and enhance accuracy. See how it works.
Microsoft UK Pricing Decreases and Increases: How to Save on Your Licence Costs in 2025
Learn how Microsoft UK pricing changes could impact your license costs and discover ways to save before April 2025.
Previewing 2025 Release Wave 1 for Dynamics 365 and Power Platform
Highlights of the 2025 Release Wave 1 for Power Platform, Dynamics 365 Sales, D365 Customer Service and Customer Insights – Journeys
Automatically create Knowledge Articles with the Copilot Knowledge Management Agent
Discover how to efficiently update your knowledge base using Dynamics 365’s Customer Knowledge Management Agent.
What Real-Time Marketing in Dynamics 365 Changes for Your Organisation
Run Dynamics 365 but manage marketing separately? See what changes when real-time marketing sits on the same platform as CRM.
Using Segments in Dynamics 365 Customer Insights
Learn about segments across Dynamics 365 Customer Insights Journeys and Data to target your audiences in your marketing campaigns.
Setup Modern reCAPTCHA in Dynamics 365 Customer Insights Forms
Microsoft finally adds reCAPTCHA to Dynamics 365 Customer Insights. Learn how to set it up, avoid pitfalls, and stop spam ruining your data.
A Clear Guide to Security Roles in Dynamics 365
A concise guide to security roles in Dynamics 365, covering permissions, privileges, access levels, and building a model that works.
Dynamics 365 – 2026 Release Wave 1 in Summary
Our summary of the 2026 Release Wave 1 for Dynamics 365. AI agents, journey upgrades, and what matters for Sales, Service, and Marketing.
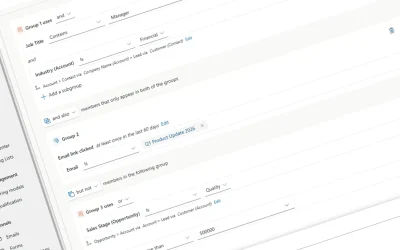
Lead Scoring in D365 Customer Insights: From Marketing Signal to Sales Action
How lead scoring in D365 Customer Insights aligns sales and marketing through scoring models, qualification rules and automated sales actions.
Create a Branded Event Hub with Power Pages and D365 Customer Insights
Bring all your Customer Insights Events in one central hub, simplifying registration while reinforcing your brand.
Faster Segmentation in Dynamics 365 Customer Insights with CSV Imports
Use Real-time Journeys CSV upload feature for creating large static segments. Drag, drop, and auto match contacts for simpler, segmentation.
12 Dynamics 365 Marketing Features: Should You Enable Them?
Review 12 optional Dynamics 365 marketing features to assess if they should be enabled within your organisation.